Switching Display (9x9)
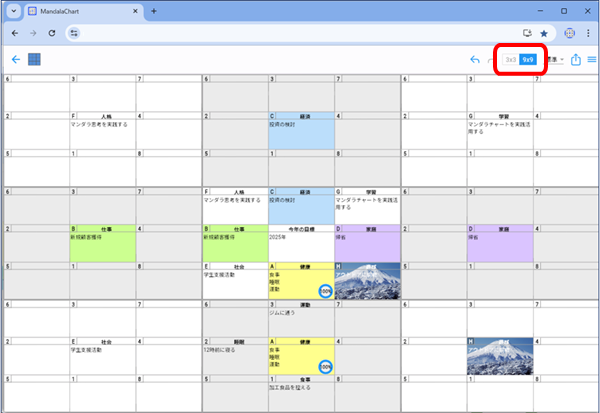
You can view all cells in full view (9x9 chart).
Click [9x9] at the top right of the screen.

The display changes to a 9x9 overall display.

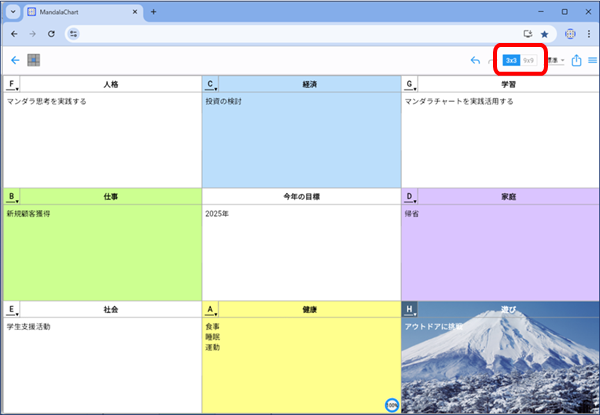
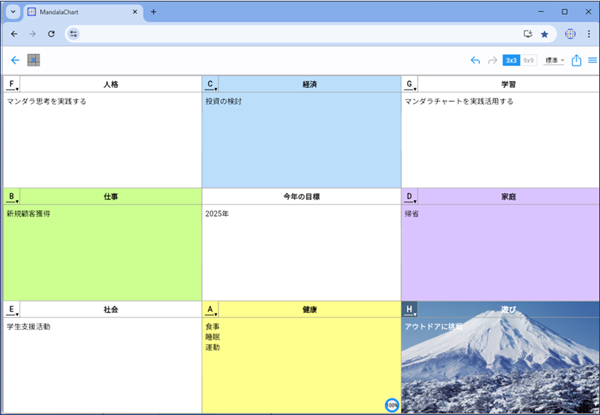
Similarly, clicking 3x3 changes to the upper layer 3x3 display.
